


About Byron: Byron Palmer is a rancher who grazes the beautiful grasslands of Sonoma County. He carries out a variety of custom grazing contracts for organic herds in Petaluma and Sonoma, and delivers services that increase both soil health and profit. In addition to custom grazing, he raises his own herd of beef steers, and sells direct to market with his brand Grounded Grasslands.

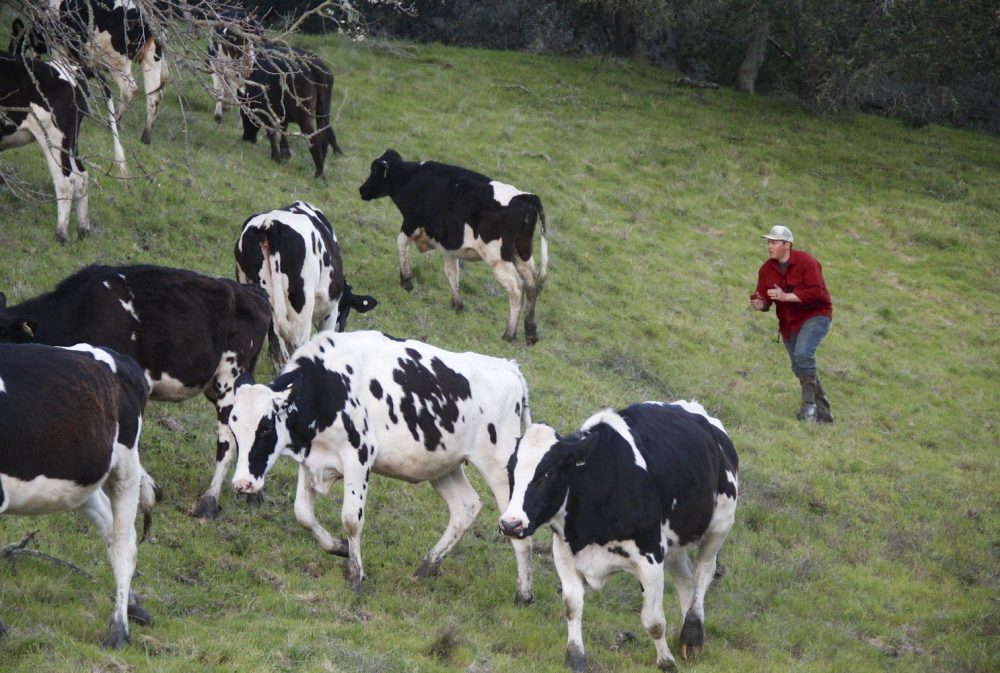
We joined Byron and his grazing partner Nate after they received a shipment of dairy heifers in from Oregon. After herding the cattle into their new paddock, Byron was happy to take a bit of time to speak with us about what he loves most about using PastureMap to manage his herds.
1. CLUTTER FREE INFORMATION:
“It’s so easy to keep my records handy,” Byron happily told us. “There’s a huge value of having all of my records stored in the cloud and not having to run around digging up paper charts.” Instead of searching through a file cabinet of maps and charts, Byron just whips out his phone to access all the information he needs to know.
2. KEEP RECORDS WITH YOU WHEREVER YOU GO:
“PastureMap helps me make better and more accurate management decisions right in the field,” Byron expressed. PastureMap allows him to keep track the head count for each pasture he grazes, and record notes on the fly. All he needs is his phone.“It makes me better informed that the herds are in the right place, at the right time, for the right reasons.”
3. MORE PROFITABLE MANAGEMENT STRATEGIES:
“With PastureMap I can keep much more granular herd records.” Byron tells us that PastureMap allows him to more easily record herd changes and moves throughout the year. Because Byron’s grazing strategy relies on moving herds every few days, paper charts just don’t do it for him. Quicker moves mean more recovery time, healthier grassland, and more profit.
4. VISUAL LAYOUT:
“It’s a relief to have a graphical map interface to look at my ranch system!” Byron loves the visual approach PastureMap takes to grazing management. He especially loves how pastures can be color coded according to recovery days. This helps him keep track of recovery period at a glance.
5. TURNS DATA INTO INSIGHTS:
“Viewing my herds on a graph and timeline is essential.” Byron showed us his herd weight graph- its a lot more intuitive than his old excel sheet column. He uses the feature to determine how often to move his cattle based on weight gain and trends.
